Theory
T15
Try to understand the general idea of the Lebesgue-Stieltjes integral and why it is useful concept and notation in Theory of Probability
The Lebesgue-Stieltjes integral is a generalization of the Riemann-Stieltjes integral which is used to integrate functions with respect to a non-decreasing, real-valued function. This integral is used to integrate functions that are not necessarily continuous or differentiable such as the Dirac delta function.
Lebesgue integration is an alternative way of defining the integral in terms of measure theory that is used to integrate a much broader class of functions than the Riemann integral or even the Riemann-Stieltjes integral. The idea behind the Lebesgue integral is that instead of approximating the total area by dividing it into vertical strips, one approximates the total area by dividing it into horizontal strips. This corresponds to asking “for each yy-value, how many xx-values produce this value?” as opposed to asking “for each xx-value, what yy-value does it produce?” Because the Lebesgue integral is defined in a way that does not depend on the structure of \mathbb{R}R, it is able to integrate many functions that cannot be integrated otherwise. Furthermore, the Lebesgue integral can define the integral in a completely abstract setting, giving rise to probability theory.
The Lebesgue integral works by calculating the value of an integral based on y-values instead of x-values
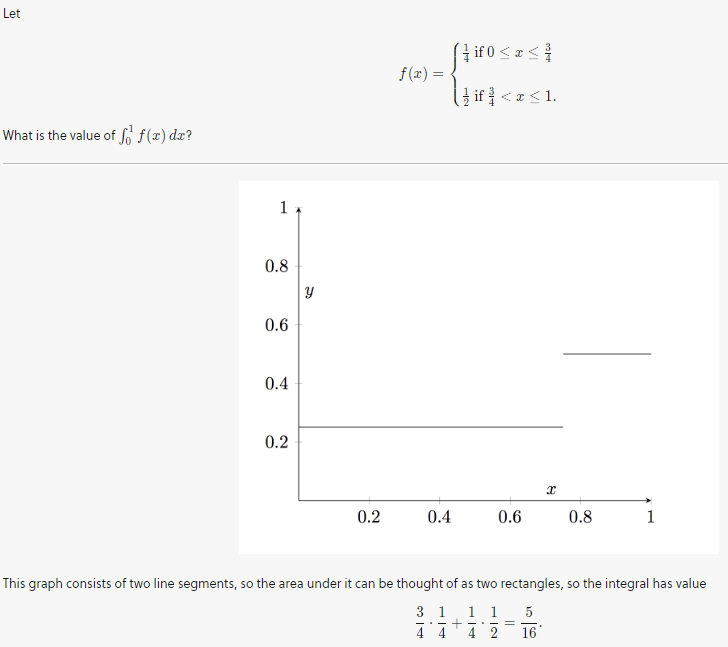
This graph consists of two line segments, so the area under it can be thought of as two rectangles, so the integral has value
When we use the Riemann integral though, we’re actually thinking about this slightly differently: we’re drawing many smaller rectangles, and using them to “approximate” the large rectangles, although in this case the approximation is exact.
In this case, the distinction between the two ways of thinking about the area is meaningless, but as the following example shows, this is not always the case.
If we try to use the Riemann integral here, because every interval contains infinitely many rational and irrational numbers, the graph of this function cannot be approximated by rectangles, so the area cannot be calculated using the Riemann integral. But using the perspective of the Lebesgue integral, since ff takes only two values, 0 and 1, all we need to do is to think about the size of the sets on which it’s taking those values and then multiply by the appropriate values.
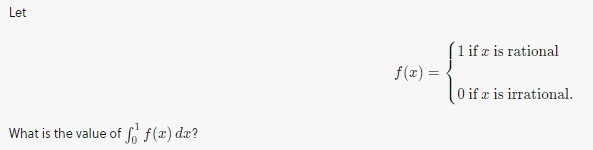
There are only countably many rationals and uncountably many irrationals, so the measure of the rationals in (0,1)(0,1) is 0, and the measure of the irrationals is 1. Since ff takes a value of 1 at the rationals, they contribute 0\cdot 1=00⋅1=0 to the integral; similarly, the irrationals contribute 1\cdot 0=01⋅0=0. Thus the value of the integral is 0. _\square
T16
Explain in your own words the “Law of large numbers” and sketch a simple proof (Markov inequality, Čebyšëv inequality, … )
The law of large numbers states that the average of a random sample of data will approach the population mean as the sample size increases. This means that the more data points you collect, the more likely it is that the average of your sample will be close to the population mean. In other words, the law states that the larger the sample size, the more accurate the average of the sample will be. This is important to understand when analyzing data, as it helps to ensure the accuracy of the results.
- Estimation of population parameters: The Law of Large Numbers can be used to estimate population parameters such as mean, variance, and proportions.
- Risk Assessment: The Law of Large Numbers can be used to assess the risk of a business or investment.
- Quality control: The Law of Large Numbers is used to assess the quality of a product or process.
- Insurance: The Law of Large Numbers is used to calculate premiums for insurance contracts.
- Sports Betting: The Law of Large Numbers is used to determine the odds of a bet.
- Portfolio Optimization: The Law of Large Numbers can be used to optimize a portfolio of investments.
- Cybersecurity: The law of large numbers in cybersecurity is the idea that the more data points that are collected, the more accurately the behavior of a system can be predicted. This is particularly relevant in the field of network security, where large amounts of data, such as traffic logs, can be used to identify potential malicious activity and better understand how threats are evolving. By analyzing large datasets and identifying patterns, organizations can better anticipate and respond to security threats.
The law of large numbers does not mean that a given sample or group of successive samples will always reflect the true population characteristics, especially for small samples. This also means that if a given sample or series of samples deviates from the true population average, the law of large numbers does not guarantee that successive samples will move the observed average toward the population mean (as suggested by the Gambler’s Fallacy). Second, the term “law of large numbers” is sometimes used in business in relation to growth rates, stated as a percentage. It suggests that, as a business expands, the percentage rate of growth becomes increasingly difficult to maintain. This is because the underlying dollar amount is actually increasing even if the growth rate as a percentage is to remain constant. The Law of Large Numbers is not to be mistaken with the Law of Averages, which states that the distribution of outcomes in a sample (large or small) reflects the distribution of outcomes of the population. Law of Large Numbers and Statistical Analysis If a person wanted to determine the average value of a data set of 100 possible values, he is more likely to reach an accurate average by choosing 20 data points instead of relying on just two. This is because there is greater probability of the two data points being outliers or non-representative of the average, while there is lower probability in all 20 data points being non-representative.
For example, if the data set included all integers from one to 100, and sample-taker only drew two values, such as 95 and 40, he may determine the average to be approximately 67.5. If he continued to take random samplings up to 20 variables, the average should shift towards the true average as he considers more data points.
Law of Large Numbers and Central Limit Theorem In statistical analysis, the law of large numbers is related to the central limit theorem. The central limit theorem states that as the sample size increases, the sample mean will be evenly distributed. This is often depicted as a bell-shaped curve where the peak of the curve depicts the mean and even distributions of sample data fall to the left and right of the curve.
In a related manner, the law of large numbers also states that data is refined as the sample grows. However, the law of large numbers more closely relates to the center of the bell curve. The law of large numbers indicates that as a sample size increases, the mean of the sample will more closely resemble the mean of the population. Therefore, the law of large numbers relates to the peak (the mean) of a curve, while the central limit theorem relates to the distribution of a curve.
Law of Large Numbers and Business Growth In business and finance, this term law of large numbers is sometimes used colloquially to refer to the observation that exponential growth rates often do not scale. This is not actually related to the law of large numbers, but may be a result of the law of diminishing marginal returns or diseconomies of scale.
The same principles can be applied to other metrics, such as market capitalization or net profit. As a result, investing decisions can be guided based on the associated difficulties that companies with very high market capitalization can experience as they relate to stock appreciation. This concept is somewhat central to growth versus value stocks, as a company may find it to maintain its business strategy of rapid growth once it achieves market success.
Law of Large Numbers in Business Example In fiscal year 2020, Tesla reported automotive sales (not gross sales) of $24.604 billion. The next year, the company reported $44.125 billion, an increase of roughly 79%. 1 As electric vehicles are an emerging market and Tesla is beginning to finally experience economies of scale, the company is started to experience success very quickly.
The law of large numbers indicates that as Tesla continues to grow, it will become harder for the company to maintain this level of productivity. For example, assuming a steady growth rate of the next several years, it becomes quickly apparent that Tesla simply cannot maintain its current growth trajectory due to the underlying dollar values becoming unreasonable
Applications
A11
Consider a general scheme ad the simulation of previous homework and simulate the distribution of p = SUM(xi) , where xi are Bernoulli(lambda/n), with success probability lambda /n, where lambda is a user constant (“arrival rate”).
Also plot the distribution of the “interarrival times”.
Finally, search on the web to understand what you have actually simulated
The code of the proposed solution can be found at this GitHub link.