Theory
T13
Try to explain in your own words, the concept of population and sampling distribution:
Population is a complete set of all elements or items in a given set of data or information. It could be a group of people, a set of objects, or a collection of variables. It is the entire set that a researcher is interested in studying.
Sampling distribution is the probability distribution of a statistic obtained from a sample. It is a probability distribution of the mean of a sample obtained from multiple samples of the same size taken from the same population. The sampling distribution represents the variability of the statistic across all possible samples of the same size and from the same population. It is an important concept in statistics as it helps us to determine the accuracy of our estimates. In statistics, a sampling distribution is a probability distribution (A statistical function that describes all the possible values that a random variable can take within a given range) of a statistic obtained from a larger number of samples drawn from a specific population. If an arbitrarily large number of samples, each involving multiple observations (data points), were separately used in order to compute one value of a statistic for each sample, then the sampling distribution is the probability distribution of the values that the statistic takes on.
To explain better the concept let see a sampling distribution of the mean example: Imagine you draw a random sample of 10 apples. Then you calculate the mean of that sample as 103 grams. That’s one sample mean from one sample. However, you realize that if you were to draw another sample, you’d obtain a different mean. A third sample would produce yet another mean. And so on. Suppose you decide to collect 50 random samples of the same apple population. Each sample contains 10 apples, and you calculate the mean for each sample. At this point, you have 50 sample averages for apple weights. You plot these sample averages in the histogram to display your sampling distribution of the mean.
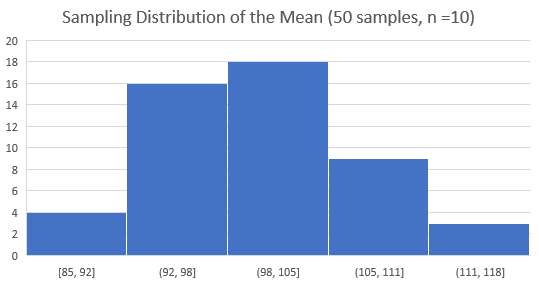
This histogram shows us that our initial sample average of 103 grams falls near the center of the sampling distribution. The averages occur in this range the most frequently. The frequency of means is highest in the sampling distribution center and decrease off in both directions. Consequently, it is very unusual to obtain sample means outside this range.
T14:
Show the expected value and variance of the sample mean and take a look at the analogous results for the sample variance
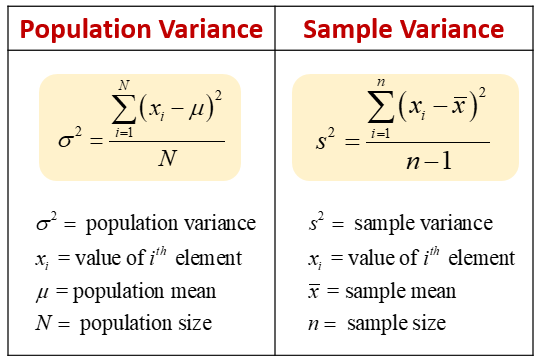
Expected Value of Sample Mean: The sample mean is the average of all the values in the sample set. It is calculated by adding up all the values in the sample and then dividing the sum by the number of values in the sample. The expected value of the sample mean is the population mean, μ.
Variance of Sample Mean: The variance of sample variance is the variance of the variance of a population, or the second moment of the population variance. It is a measure of the variability of the population variance. It is calculated by taking the second moment of the population variance, which is the sum of the squared deviations of the population variance from its mean. The variance of the sample mean is given by σ2/n, where σ2 is the population variance and n is the sample size.
Expected Value of Sample Variance: The expected value of the sample variance is the population variance, σ2.
Variance of Sample Variance: The variance of the sample variance is given by 2σ4/(n-1), where σ4 is the fourth moment of the population and n is the sample size.
This histogram shows us that our initial sample average of 103 grams falls near the center of the sampling distribution. The averages occur in this range the most frequently. The frequency of means is highest in the sampling distribution center and decrease off in both directions. Consequently, it is very unusual to obtain sample means outside this range.
Example 1
The mean weight of all football players at a particular high school is 170 pounds with a standard deviation of 5 pounds. Find the variance of the sampling distribution of a sample mean if the sample size is 20.
Step 1: Identify the size of the samples, N, and the variance of the population. Remember that the population variance, σ2, is the population standard deviation squared.
The size of the samples is 20, so N = 20.
The population standard deviation is 5 pounds, and so the population variance can be found by squaring this value.

Step 2: Calculate the variance of the sampling distribution of a sample mean using the formula

The variance of the sampling distribution of a sample mean is found by dividing the population variance by the sample size.
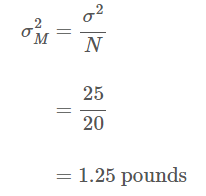
The variance of the sampling distribution of sample means is 1.25 pounds.
Applications
A10:
Take any population and any variable X. Draw m (large) samples of size n (as you like) and represent the following two empirical sampling distributions: Sampling Distribution of the Mean and Sampling Distribution of the Variance.
Finally, for each empirical sampling distribution compute the empirical sample mean and empirical sample variance and compare with the corrisponding values in the population. The proposed solution is in the ZIP file that can be found at this GitHub link.